Investment Opportunity
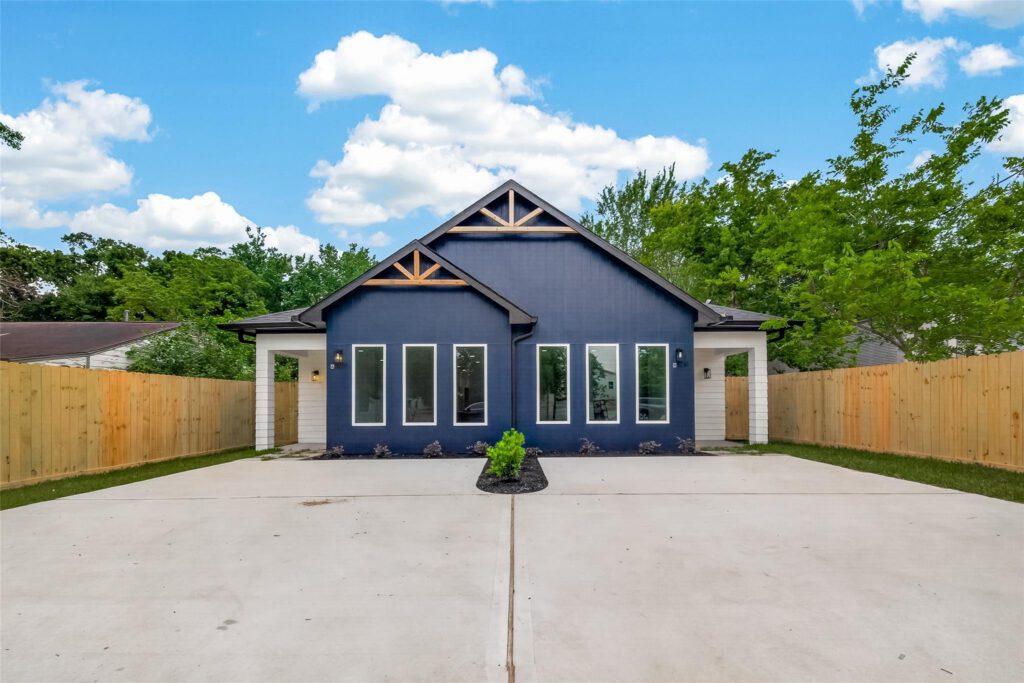
Woodward
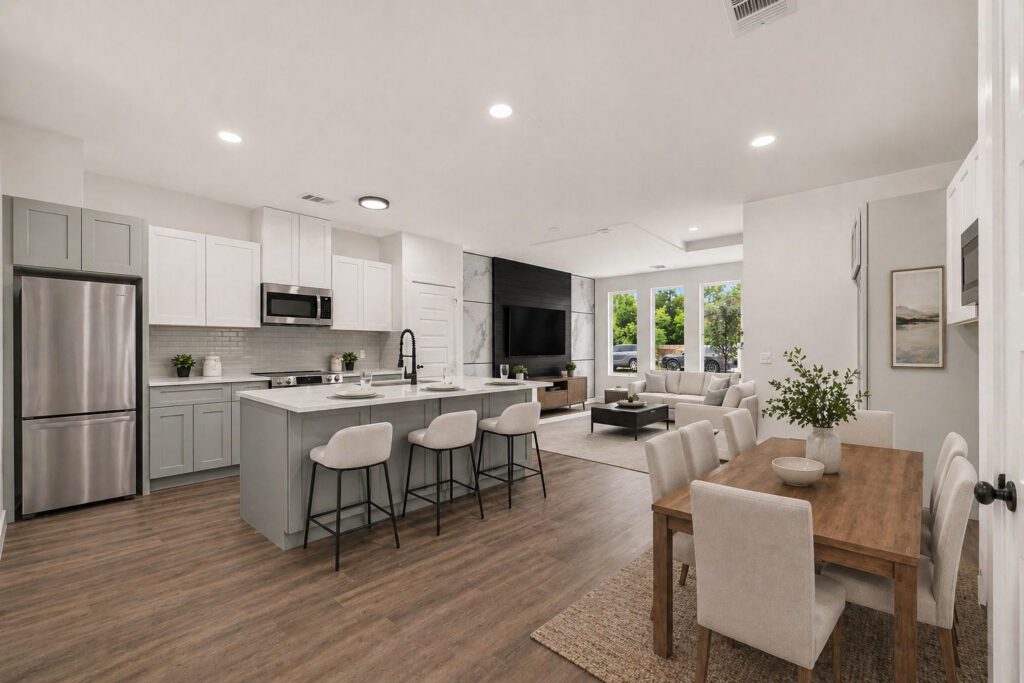
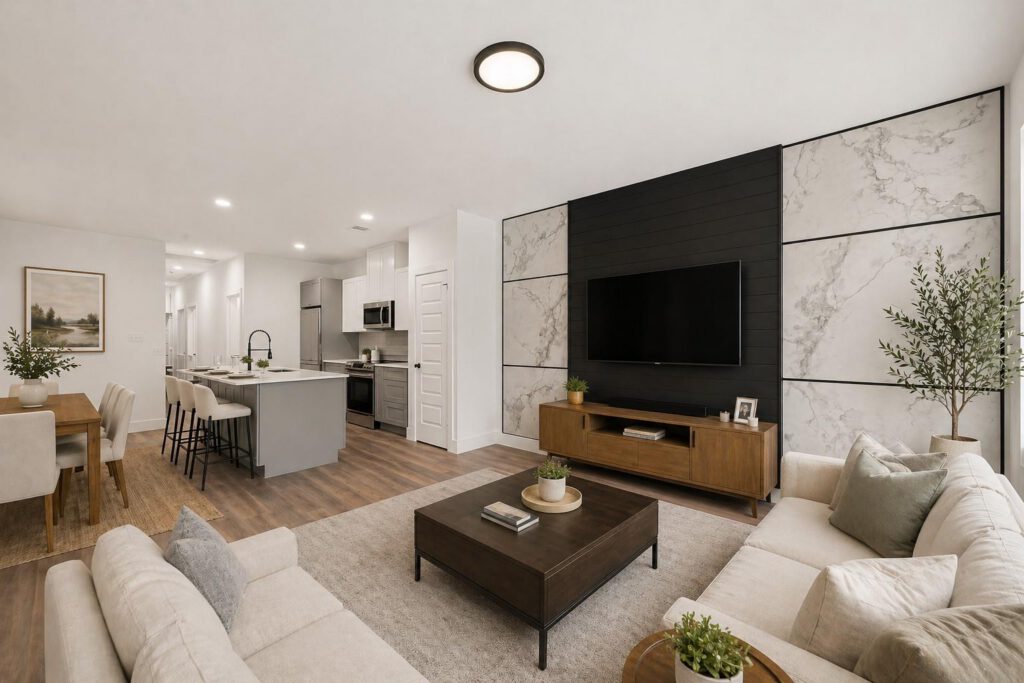
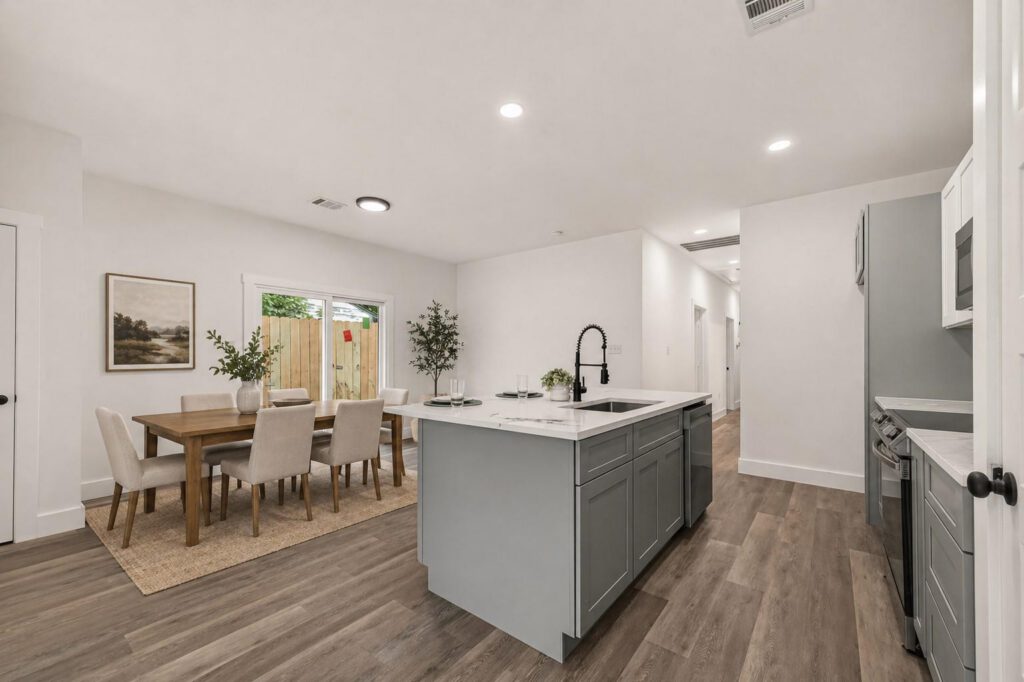
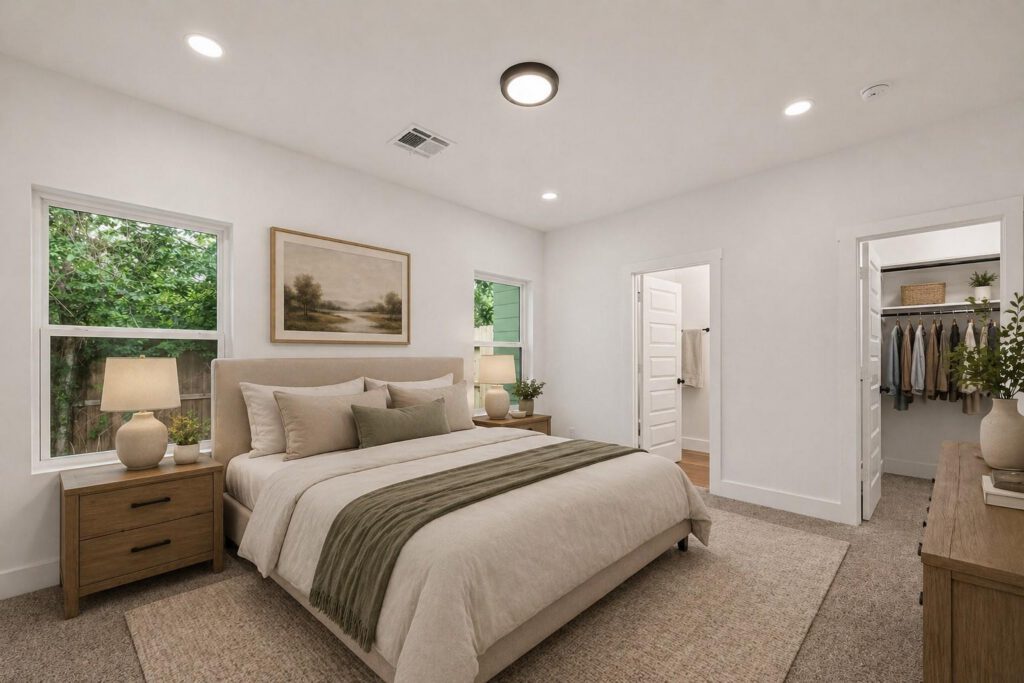
Image Gallery
Property Details
Guests
6
6
Investment Structure
Total Investment Required
$539,900
$539,900
Total Units
11
11
Price Per Unit
$50,000
$50,000
Ownership Per Unit
9.09%
9.09%
Minimum Units
1
1
Holding Period (Years)
5
5
Cash Flow
Annual Cash Flow – 5-Year Analysis
| Category | Year 0 | Year 1 | Year 2 | Year 3 | Year 4 | Year 5 | Total |
|---|---|---|---|---|---|---|---|
| INITIAL INVESTMENT (YEAR 0) | |||||||
| Purchase Price | -$479,900 | – | – | – | – | – | -$479,900 |
| Closing Costs | – | – | – | – | – | – | – |
| Setup Fees | -$7,000 | – | – | – | – | – | -$7,000 |
| Legal Fees | -$3,000 | – | – | – | – | – | -$3,000 |
| Rehab / Furnishing | -$50,000 | – | – | – | – | – | -$50,000 |
| Initial Reserve | – | – | – | – | – | – | – |
| Total Capital Deployed | -$539,900 | – | – | – | – | – | -$539,900 |
| BOOKING REVENUE | |||||||
| Booking Revenue | – | $81,413 | $83,890 | $86,441 | $89,070 | $91,780 | $432,595 |
| ↳ Unit 1 | – | $40,150 | $41,355 | $42,595 | $43,873 | $45,189 | $213,162 |
| ↳ Unit 2 | – | $40,150 | $41,355 | $42,595 | $43,873 | $45,189 | $213,162 |
| ↳ Platform Fees | – | -$2,442 | -$2,517 | -$2,593 | -$2,672 | -$2,753 | -$12,978 |
| Net Revenue | – | $85,541 | $88,143 | $90,824 | $93,586 | $96,433 | $454,526 |
| EXPENSES | |||||||
| Bills & Expenses | – | -$28,314 | -$28,574 | -$28,842 | -$29,119 | -$29,403 | -$144,253 |
| ↳ Property Tax | – | -$6,000 | -$6,000 | -$6,000 | -$6,000 | -$6,000 | -$30,000 |
| ↳ Insurance | – | -$1,200 | -$1,200 | -$1,200 | -$1,200 | -$1,200 | -$6,000 |
| ↳ HOA | – | – | – | – | – | – | – |
| ↳ Maintenance | – | -$2,000 | -$2,000 | -$2,000 | -$2,000 | -$2,000 | -$10,000 |
| ↳ Property Mgmt | – | -$8,554 | -$8,814 | -$9,082 | -$9,359 | -$9,643 | -$45,453 |
| ↳ Utilities | – | -$4,800 | -$4,800 | -$4,800 | -$4,800 | -$4,800 | -$24,000 |
| ↳ Cleaning | – | -$5,760 | -$5,760 | -$5,760 | -$5,760 | -$5,760 | -$28,800 |
| ↳ Reserves | – | – | – | – | – | – | – |
| RETURNS | |||||||
| Income After Bills | – | $57,227 | $59,568 | $61,981 | $64,467 | $67,029 | $310,273 |
| Cash Flow | – | $57,227 | $59,568 | $61,981 | $64,467 | $67,029 | $310,273 |
| Running Total | -$539,900 | -$482,673 | -$423,105 | -$361,124 | -$296,656 | -$229,627 | -$229,627 |
| PROPERTY SALE – END OF YEAR 5 | |||||||
| Estimated Sale Value | – | – | – | – | – | $479,900 | $479,900 |
| Selling Costs | – | – | – | – | – | -$50,272 | -$50,272 |
| Net Sale Proceeds | – | – | – | – | – | $787,595 | $787,595 |
| Total Cash Received | – | – | – | – | – | $854,624 | $1,097,868 |
Profitability Analysis
Total ROI
103.35%
103.35%
Cash-on-Cash
10.6%
10.6%
Cap Rate
11.92%
11.92%
Projected IRR
18.61%
18.61%
Projected Sale
$837,867
$837,867
Net Sale Proceeds
$787,595
$787,595
Total Return
$557,968
$557,968
Exit & Returns
Investor Total Return
$568,406
$568,406
Investor Annualized Return
20.67%
20.67%