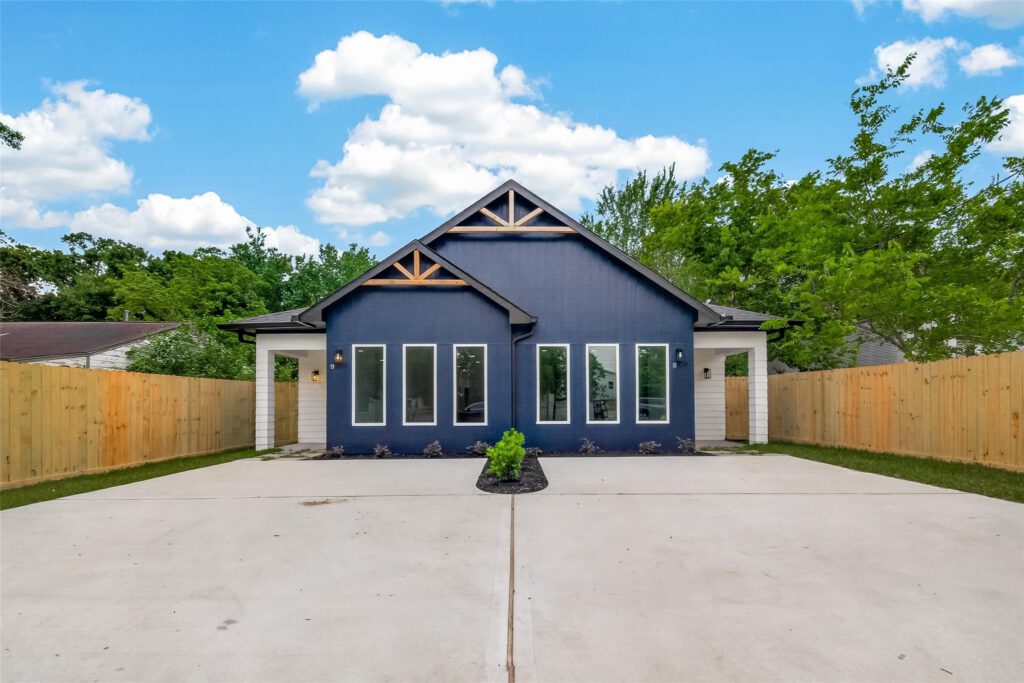
Investment Opportunity
Woodward
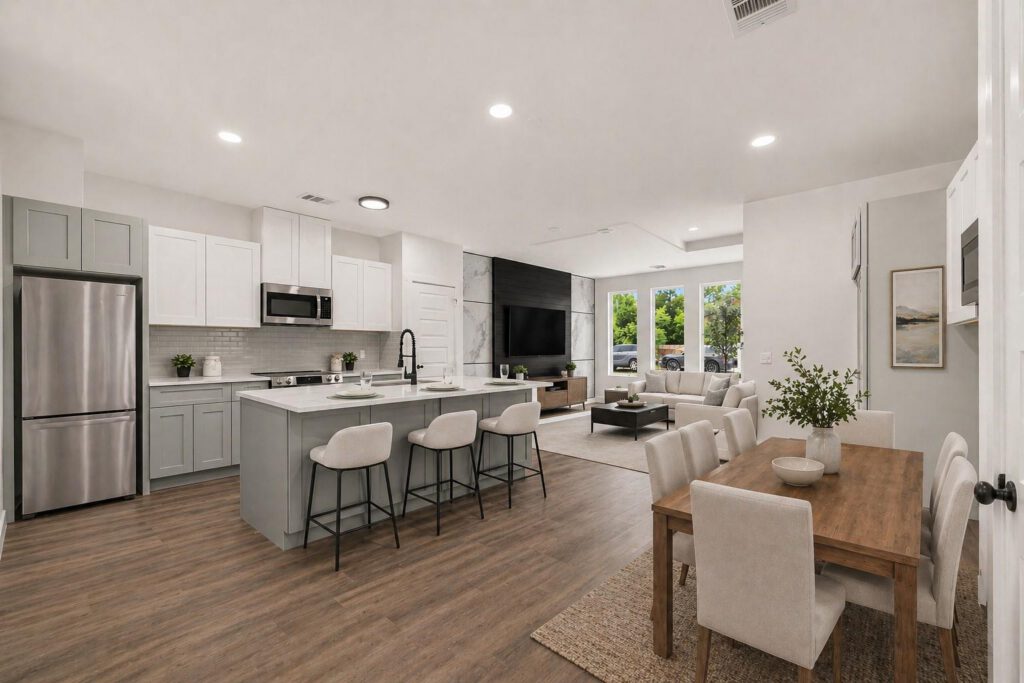
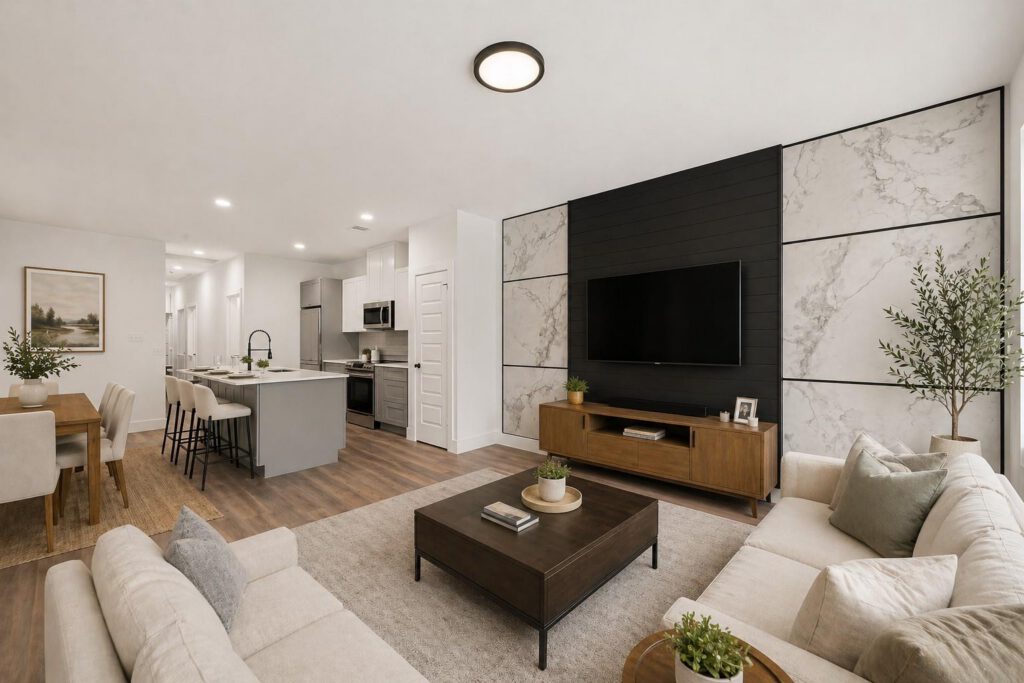
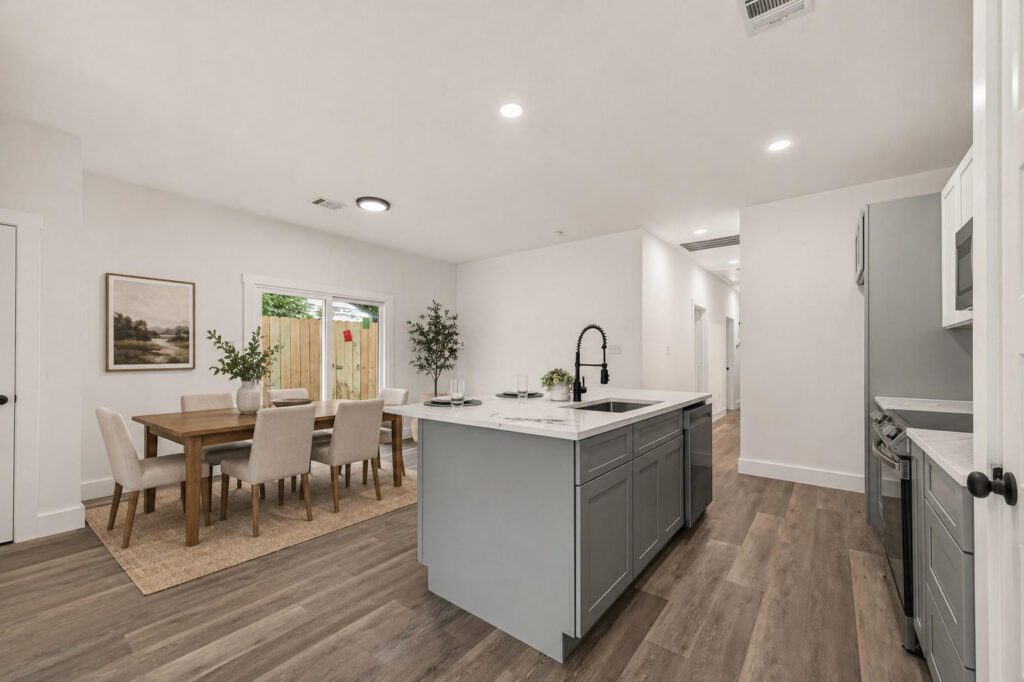
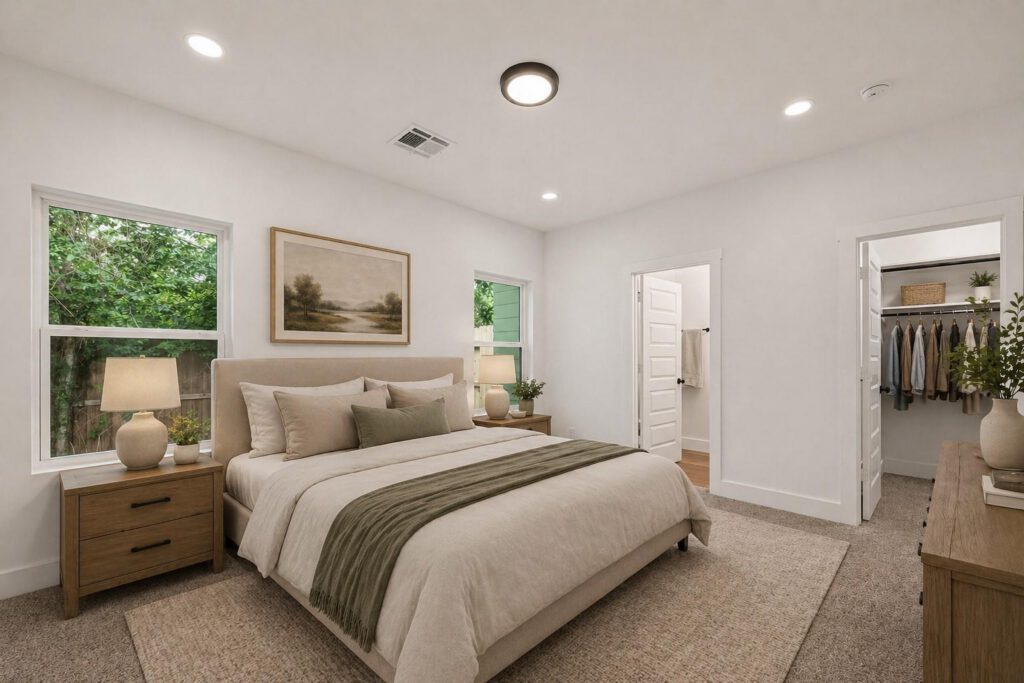
Image Gallery
Property Details
City
Houston
Houston
State
TX
TX
Zip Code
77051
77051
Beds
3
3
Baths
2
2
Area
2,489 sqft
2,489 sqft
Year Built
2026
2026
Property Type
Multi Family
Multi Family
Guests per Unit
6
6
Capital Summary
Purchase Price
$479,900
$479,900
Furnishing Cost
$40,000
$40,000
Setup Fees
$3,000
$3,000
Legal Fees
$3,000
$3,000
Total Budget
$525,900
$525,900
Investment Structure
Total Investment Required
$525,900
$525,900
Total Units
11
11
Price Per Unit
$50,000
$50,000
Ownership Per Unit
9.09%
9.09%
Minimum Units
1
1
Holding Period (Years)
5
5
Profitability Analysis
Total ROI
83.16%
83.16%
Cap Rate
14.83%
14.83%
Net Sale Proceeds
$578,931
$578,931
Total Net Rental Income
$384,329
$384,329
Equity Multiple
1.83
1.83
Total Return
$437,360
$437,360
Average Monthly Cash Flow
6,405
6,405
Average Annual Lifecycle ROI
16.63%
16.63%
Cash Flow
Annual Cash Flow – 5-Year Analysis
| Category | Year 0 | Year 1 | Year 2 | Year 3 | Year 4 | Year 5 | Total |
|---|---|---|---|---|---|---|---|
| INITIAL INVESTMENT (YEAR 0) | |||||||
| Purchase Price | -$479,900 | – | – | – | – | – | -$479,900 |
| Closing Costs | – | – | – | – | – | – | – |
| Setup Fees | -$3,000 | – | – | – | – | – | -$3,000 |
| Legal Fees | -$3,000 | – | – | – | – | – | -$3,000 |
| Rehab / Furnishing | -$40,000 | – | – | – | – | – | -$40,000 |
| Initial Reserve | – | – | – | – | – | – | – |
| Total Capital Deployed | -$525,900 | – | – | – | – | – | -$525,900 |
| BOOKING REVENUE | |||||||
| Booking Revenue | – | $101,027 | $104,099 | $107,266 | $110,528 | $113,890 | $536,810 |
| ↳ Unit 1 | – | $49,823 | $51,317 | $52,857 | $54,442 | $56,076 | $264,514 |
| ↳ Unit 2 | – | $49,823 | $51,317 | $52,857 | $54,442 | $56,076 | $264,514 |
| ↳ City / Lodging Tax | – | – | – | – | – | – | – |
| ↳ Platform Fees | – | -$10,103 | -$10,410 | -$10,727 | -$11,053 | -$11,389 | -$53,681 |
| Net Revenue | – | $90,924 | $93,689 | $96,539 | $99,475 | $102,501 | $483,129 |
| EXPENSES | |||||||
| Bills & Expenses | – | -$19,760 | -$19,760 | -$19,760 | -$19,760 | -$19,760 | -$98,800 |
| ↳ Property Tax | – | -$6,000 | -$6,000 | -$6,000 | -$6,000 | -$6,000 | -$30,000 |
| ↳ Insurance | – | -$1,200 | -$1,200 | -$1,200 | -$1,200 | -$1,200 | -$6,000 |
| ↳ Maintenance | – | -$2,000 | -$2,000 | -$2,000 | -$2,000 | -$2,000 | -$10,000 |
| ↳ Utilities | – | -$4,800 | -$4,800 | -$4,800 | -$4,800 | -$4,800 | -$24,000 |
| ↳ Cleaning | – | -$5,760 | -$5,760 | -$5,760 | -$5,760 | -$5,760 | -$28,800 |
| RETURNS | |||||||
| Income After Bills | – | $71,164 | $73,929 | $76,779 | $79,715 | $82,741 | $384,329 |
| Cash Flow | – | $71,164 | $73,929 | $76,779 | $79,715 | $82,741 | $384,329 |
| Running Total | -$525,900 | -$454,736 | -$380,807 | -$304,028 | -$224,312 | -$141,571 | -$141,571 |
| PROPERTY SALE – END OF YEAR 5 | |||||||
| Estimated Sale Value | – | – | – | – | – | $615,884 | $615,884 |
| Selling Costs | – | – | – | – | – | -$36,953 | -$36,953 |
| Net Sale Proceeds | – | – | – | – | – | $578,931 | $578,931 |
| Total Cash Received | – | – | – | – | – | $661,672 | $963,260 |