Investment Opportunity
Coffee
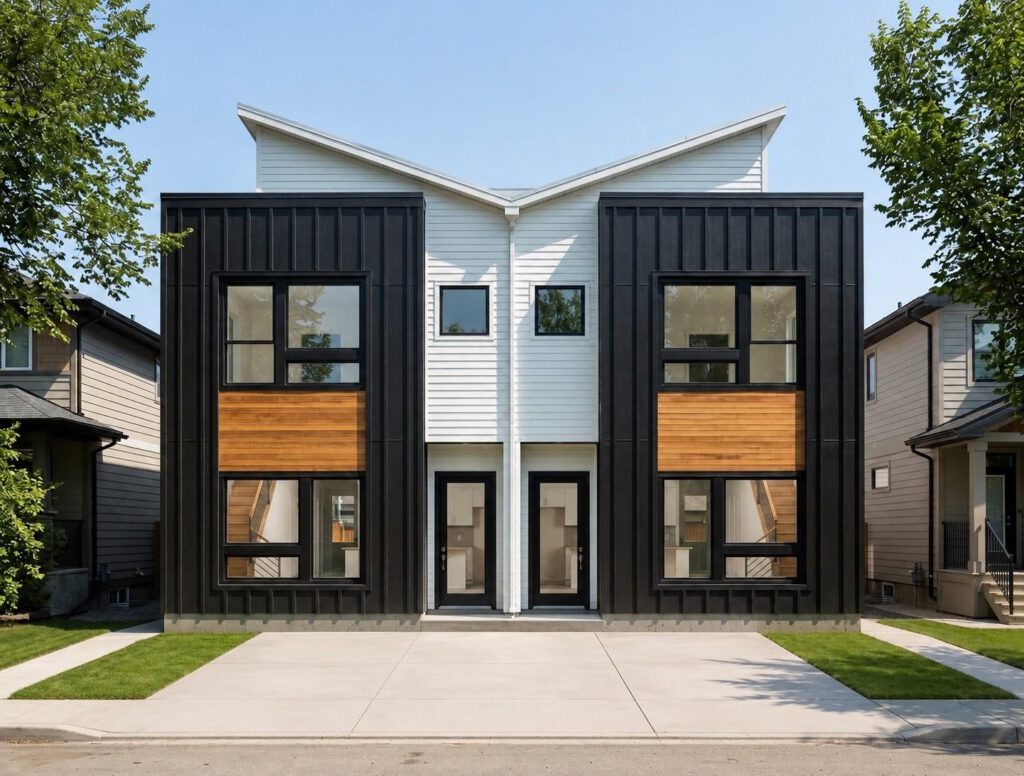
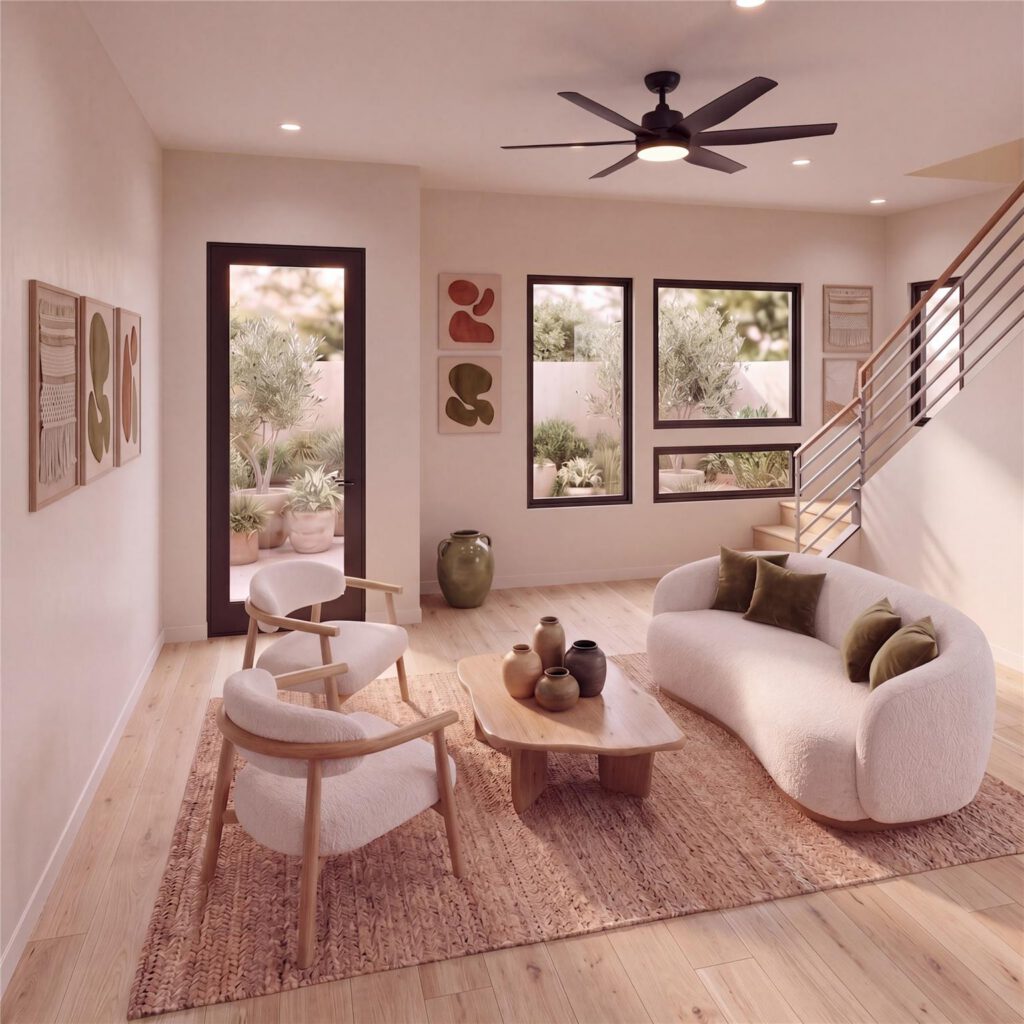
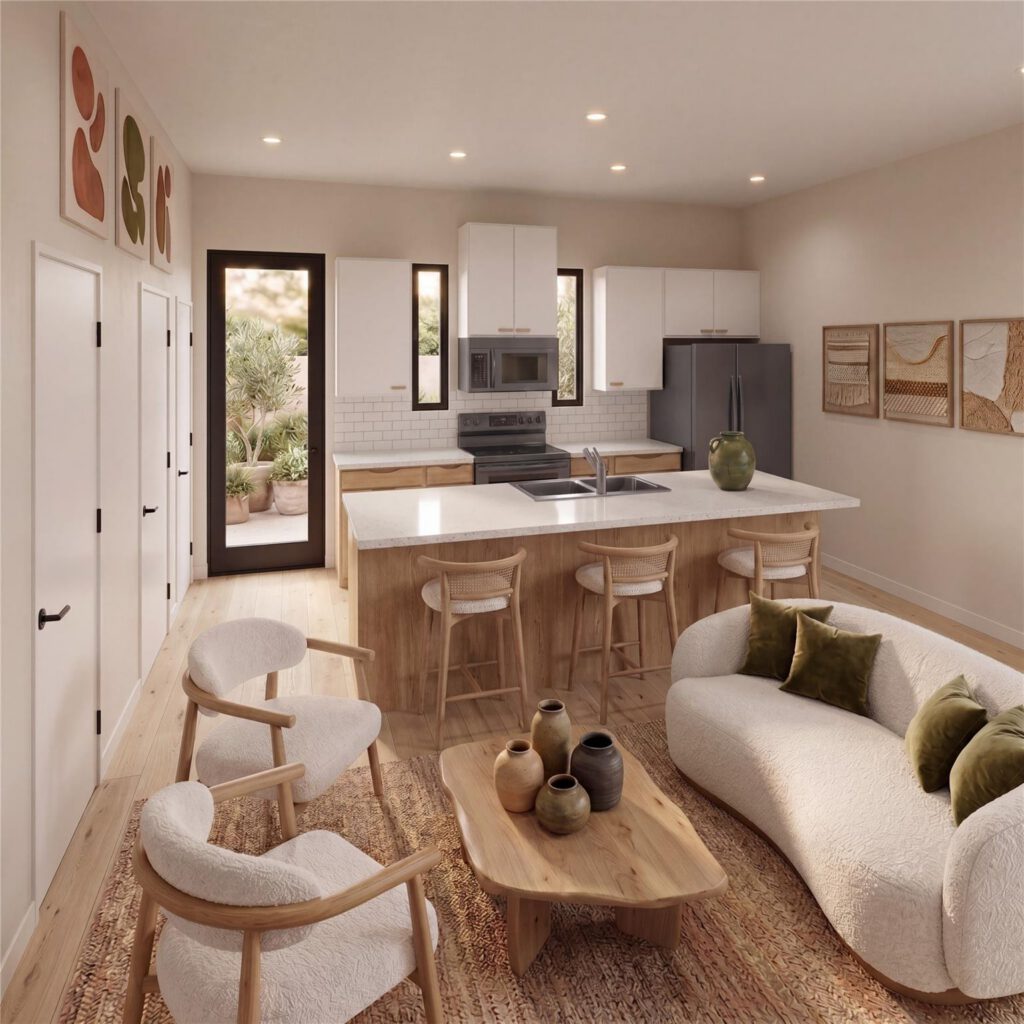
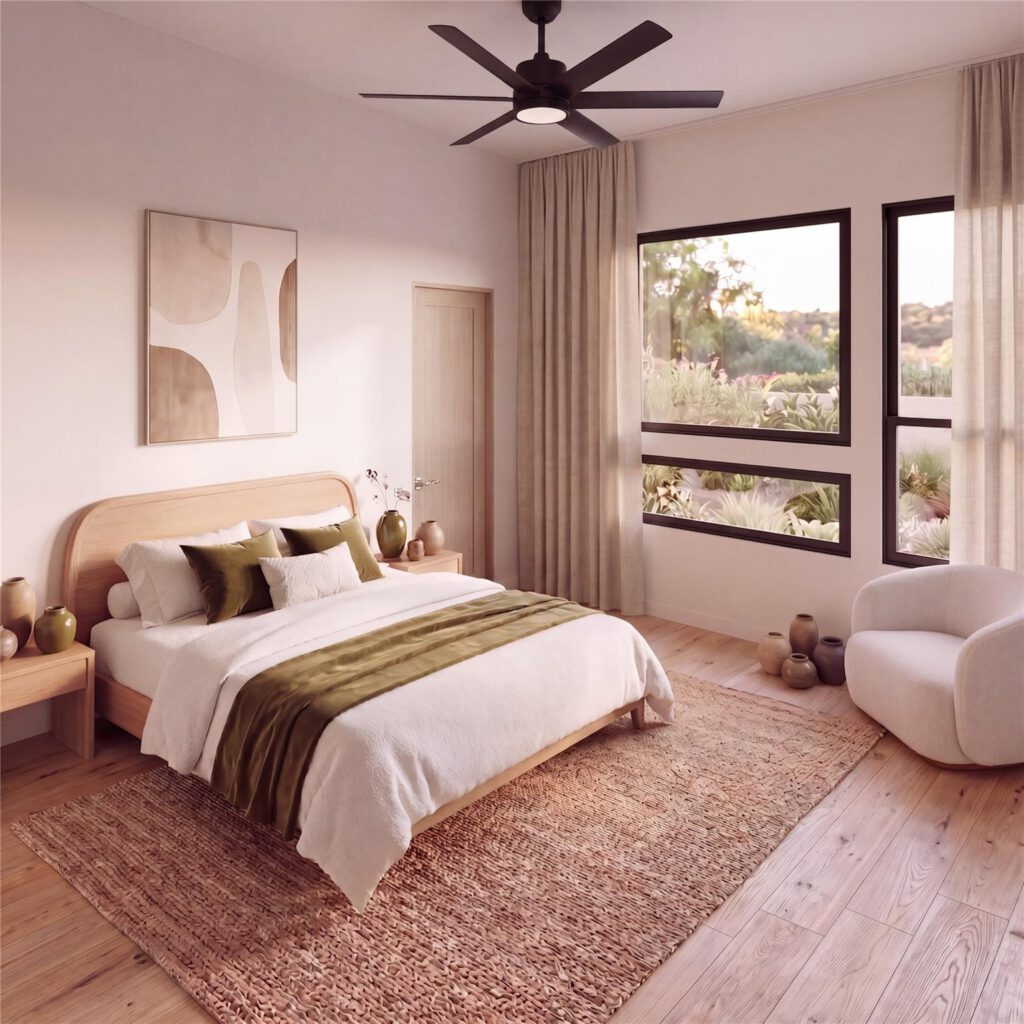
Image Gallery
Property Details
City
Houston
Houston
State
TX
TX
Zip Code
77033
77033
Beds
2
2
Baths
2
2
Area
2,000 sqft
2,000 sqft
Year Built
2026
2026
Property Type
Multi Family
Multi Family
Guests per Unit
6
6
Capital Summary
Purchase Price
$515,000
$515,000
Furnishing Cost
$40,000
$40,000
Setup Fees
$3,000
$3,000
Legal Fees
$3,000
$3,000
Total Budget
$561,000
$561,000
Investment Structure
Total Investment Required
$561,000
$561,000
Total Units
11
11
Price Per Unit
$50,000
$50,000
Ownership Per Unit
9.09%
9.09%
Minimum Units
1
1
Holding Period (Years)
5
5
Profitability Analysis
Total ROI
72.14%
72.14%
Cap Rate
10.06%
10.06%
Net Sale Proceeds
$621,274
$621,274
Total Net Rental Income
$344,428
$344,428
Equity Multiple
1.72
1.72
Total Return
$404,702
$404,702
Average Monthly Cash Flow
5,740
5,740
Average Annual Lifecycle ROI
14.43%
14.43%
Cash Flow
Annual Cash Flow – 5-Year Analysis
| Category | Year 0 | Year 1 | Year 2 | Year 3 | Year 4 | Year 5 | Total |
|---|---|---|---|---|---|---|---|
| INITIAL INVESTMENT (YEAR 0) | |||||||
| Purchase Price | -$515,000 | – | – | – | – | – | -$515,000 |
| Closing Costs | – | – | – | – | – | – | – |
| Setup Fees | -$3,000 | – | – | – | – | – | -$3,000 |
| Legal Fees | -$3,000 | – | – | – | – | – | -$3,000 |
| Rehab / Furnishing | -$40,000 | – | – | – | – | – | -$40,000 |
| Initial Reserve | – | – | – | – | – | – | – |
| Total Capital Deployed | -$561,000 | – | – | – | – | – | -$561,000 |
| BOOKING REVENUE | |||||||
| Booking Revenue | – | $96,315 | $106,401 | $117,542 | $129,850 | $143,447 | $593,555 |
| ↳ Unit 1 | – | $45,990 | $50,589 | $55,648 | $61,213 | $67,334 | $280,774 |
| ↳ Unit 2 | – | $45,990 | $50,589 | $55,648 | $61,213 | $67,334 | $280,774 |
| ↳ City / Lodging Tax | – | -$12,521 | -$13,832 | -$15,280 | -$16,881 | -$18,648 | -$77,162 |
| ↳ Platform Fees | – | -$9,632 | -$10,640 | -$11,754 | -$12,985 | -$14,345 | -$59,356 |
| Net Revenue | – | $74,163 | $81,928 | $90,507 | $99,985 | $110,454 | $457,038 |
| EXPENSES | |||||||
| Bills & Expenses | – | -$22,378 | -$22,443 | -$22,514 | -$22,593 | -$22,681 | -$112,609 |
| ↳ Property Tax | – | -$8,000 | -$8,000 | -$8,000 | -$8,000 | -$8,000 | -$40,000 |
| ↳ Insurance | – | -$1,200 | -$1,200 | -$1,200 | -$1,200 | -$1,200 | -$6,000 |
| ↳ Maintenance | – | -$2,000 | -$2,000 | -$2,000 | -$2,000 | -$2,000 | -$10,000 |
| ↳ Property Mgmt | – | -$618 | -$683 | -$754 | -$833 | -$920 | -$3,809 |
| ↳ Utilities | – | -$4,800 | -$4,800 | -$4,800 | -$4,800 | -$4,800 | -$24,000 |
| ↳ Cleaning | – | -$5,760 | -$5,760 | -$5,760 | -$5,760 | -$5,760 | -$28,800 |
| RETURNS | |||||||
| Income After Bills | – | $51,785 | $59,486 | $67,993 | $77,391 | $87,774 | $344,428 |
| Cash Flow | – | $51,785 | $59,486 | $67,993 | $77,391 | $87,774 | $344,428 |
| Running Total | -$561,000 | -$509,215 | -$449,730 | -$381,737 | -$304,345 | -$216,572 | -$216,572 |
| PROPERTY SALE – END OF YEAR 5 | |||||||
| Estimated Sale Value | – | – | – | – | – | $660,930 | $660,930 |
| Selling Costs | – | – | – | – | – | -$39,656 | -$39,656 |
| Net Sale Proceeds | – | – | – | – | – | $621,274 | $621,274 |
| Total Cash Received | – | – | – | – | – | $709,048 | $965,702 |