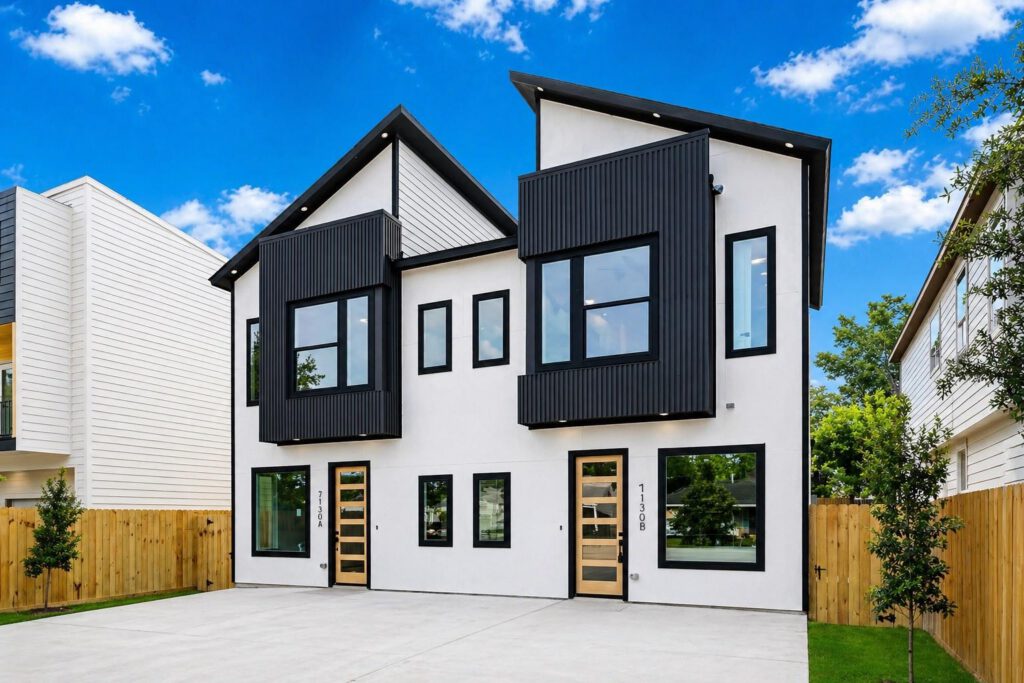
Investment Opportunity
Augustine
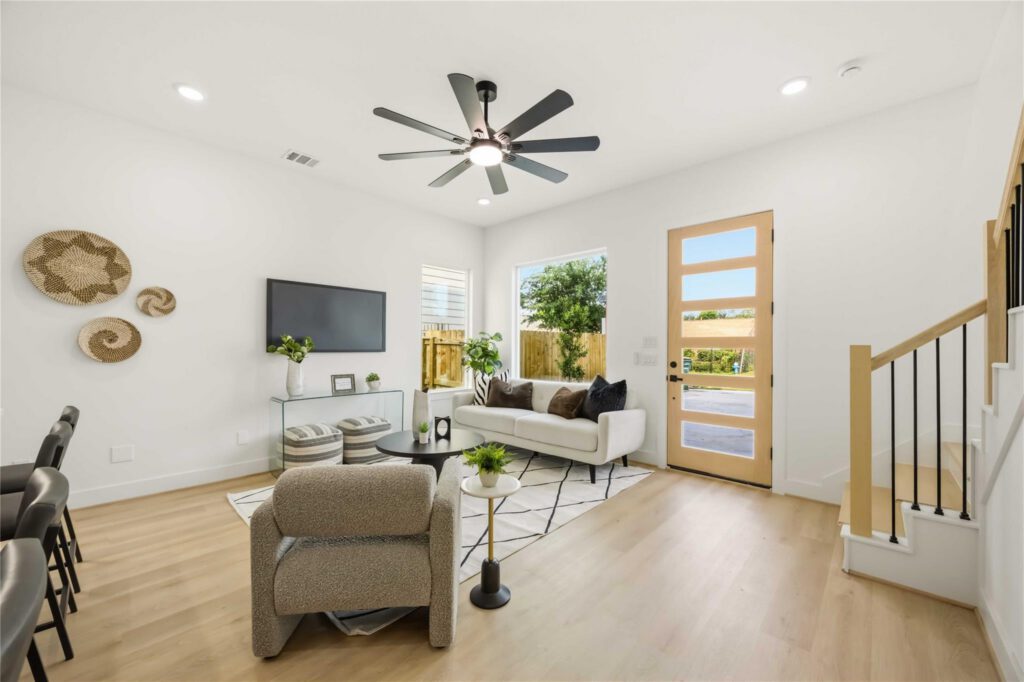
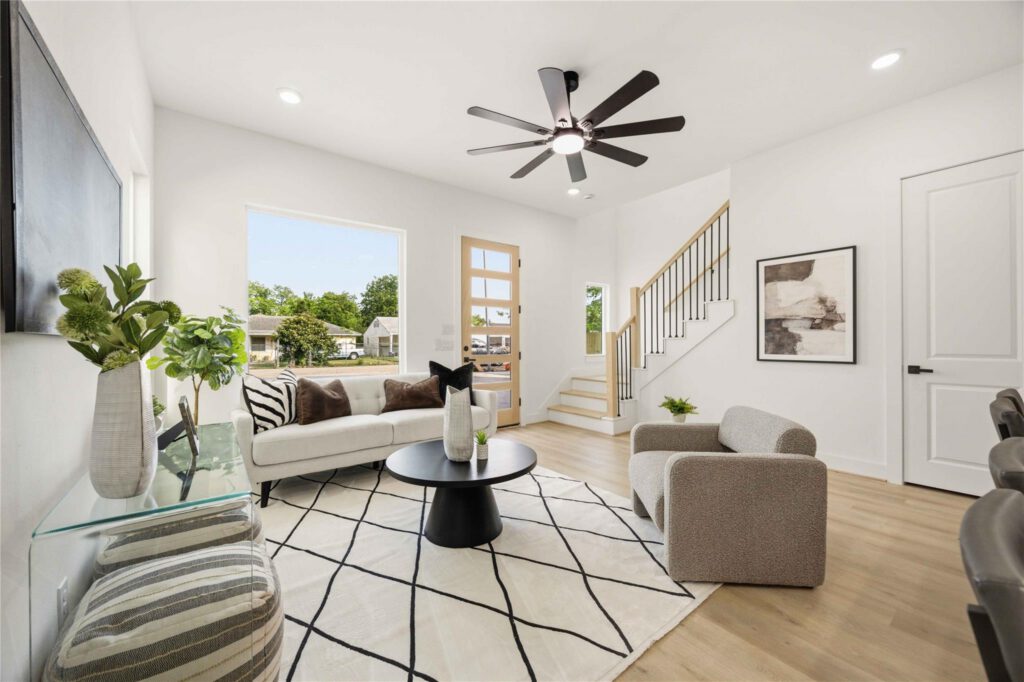
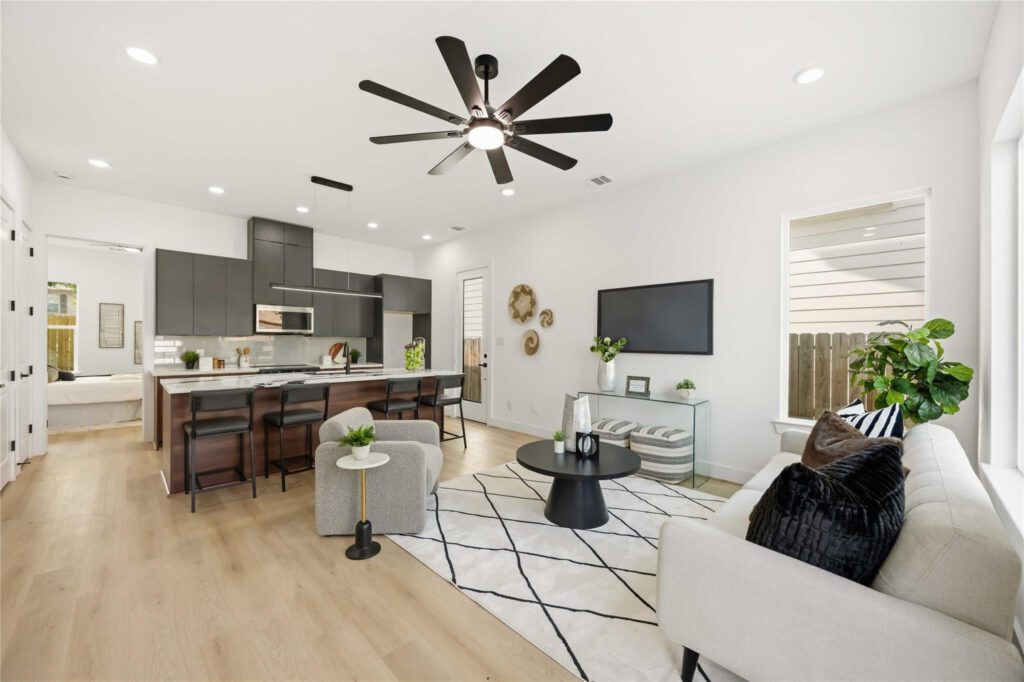
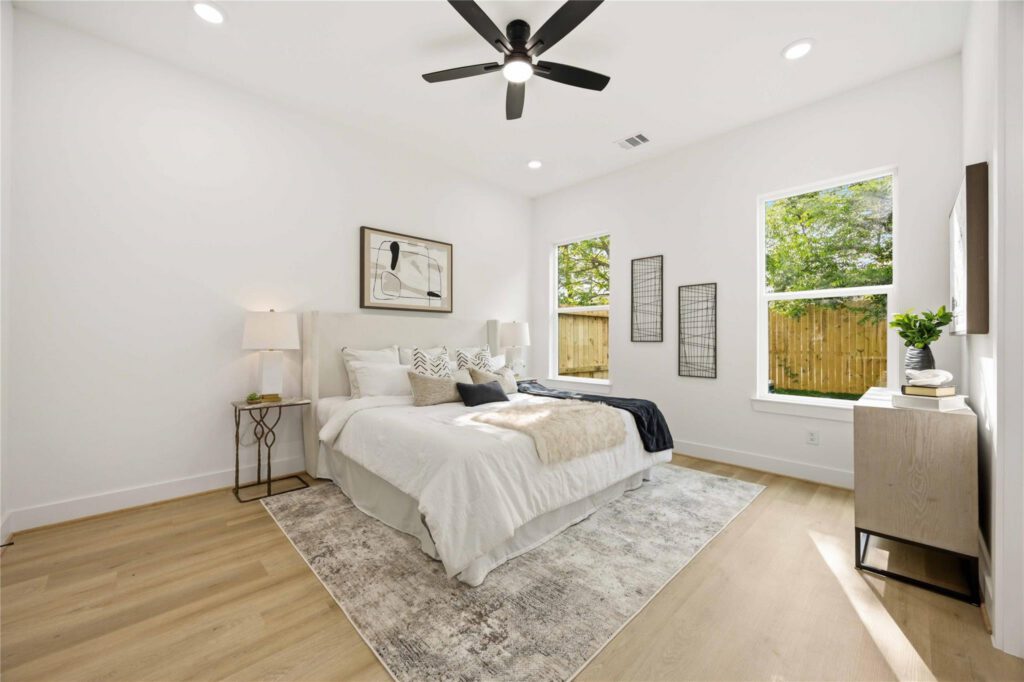
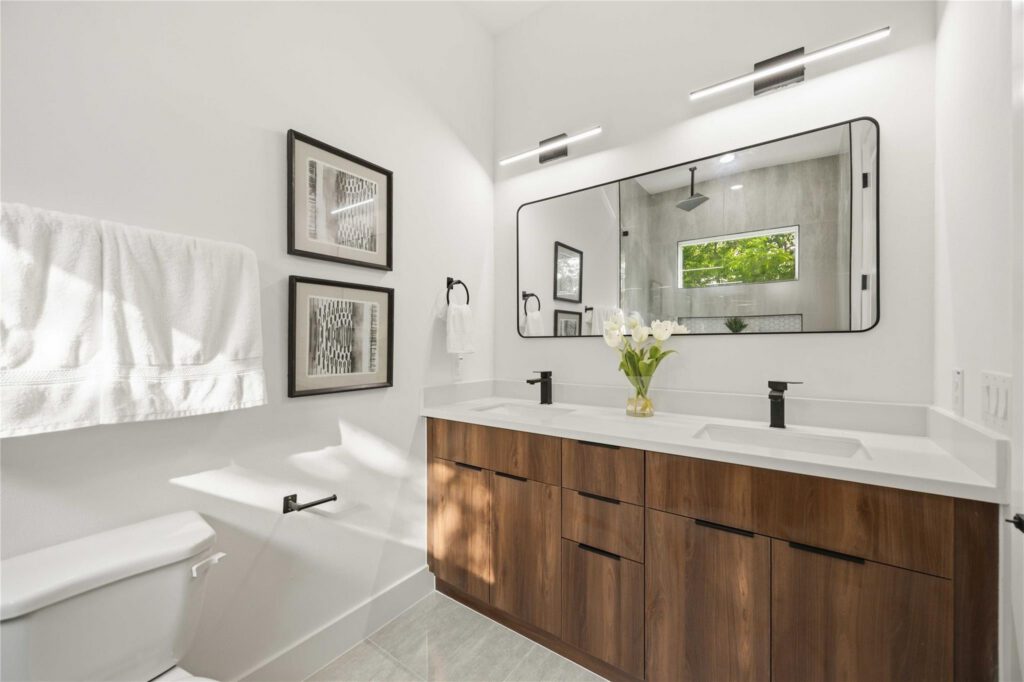
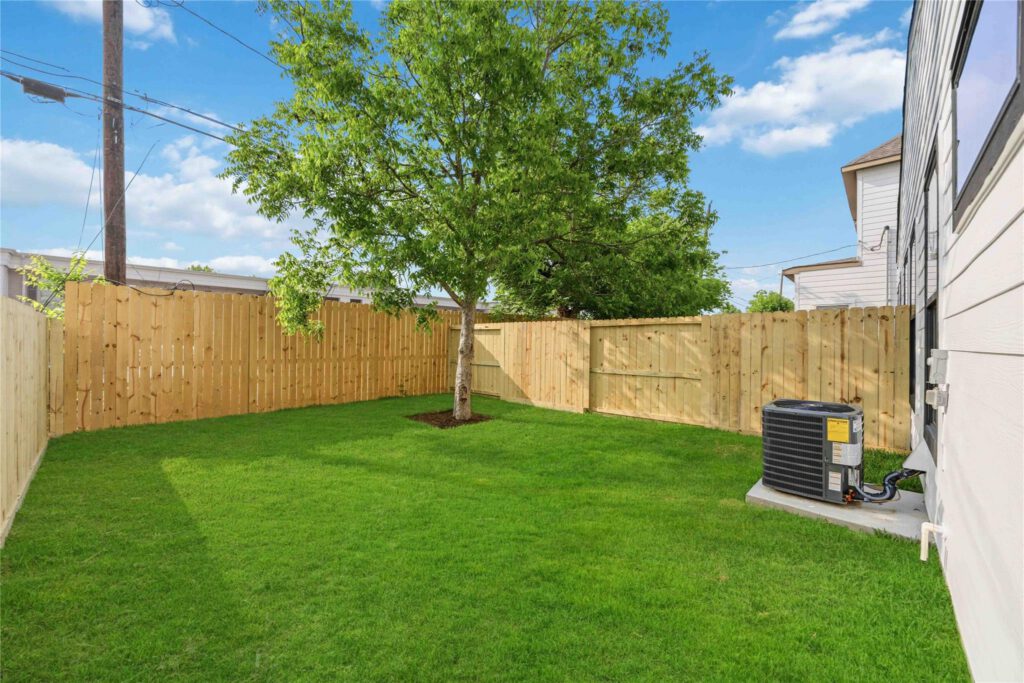
Image Gallery
Property Details
City
Houston
Houston
State
TX
TX
Zip Code
77021
77021
Beds
3
3
Baths
2
2
Aread
2,600 sqft
2,600 sqft
Guests per Unit
6
6
Year Built
2026
2026
Capital Summary
Purchase Price
$489,900
$489,900
Furnishing Cost
$50,000
$50,000
Setup Fees
$7,000
$7,000
Legal Fees
$3,000
$3,000
Total Budget
$549,900
$549,900
Investment Structure
Total Investment Required
$549,900
$549,900
Total Units
11
11
Price Per Unit
$50,000
$50,000
Ownership Per Unit
9.09%
9.09%
Minimum Units
1
1
Holding Period (Years)
5
5
Profitability Analysis
Total ROI
80.59%
80.59%
Cap Rate
10.56%
10.56%
Net Sale Proceeds
$712,449
$712,449
Total Net Rental Income
$280,634
$280,634
Equity Multiple
1.81
1.81
Total Return
$443,183
$443,183
Average Monthly Cash Flow
4,677
4,677
Average Annual Lifecycle ROI
16.12%
16.12%
Cash Flow
Annual Cash Flow – 5-Year Analysis
| Category | Year 0 | Year 1 | Year 2 | Year 3 | Year 4 | Year 5 | Total |
|---|---|---|---|---|---|---|---|
| INITIAL INVESTMENT (YEAR 0) | |||||||
| Purchase Price | -$489,900 | – | – | – | – | – | -$489,900 |
| Closing Costs | – | – | – | – | – | – | – |
| Setup Fees | -$7,000 | – | – | – | – | – | -$7,000 |
| Legal Fees | -$3,000 | – | – | – | – | – | -$3,000 |
| Rehab / Furnishing | -$50,000 | – | – | – | – | – | -$50,000 |
| Initial Reserve | – | – | – | – | – | – | – |
| Total Capital Deployed | -$549,900 | – | – | – | – | – | -$549,900 |
| BOOKING REVENUE | |||||||
| Booking Revenue | – | $70,312 | $72,450 | $74,654 | $76,925 | $79,264 | $373,604 |
| ↳ Unit 1 | – | $34,675 | $35,715 | $36,787 | $37,890 | $39,027 | $184,094 |
| ↳ Unit 2 | – | $34,675 | $35,715 | $36,787 | $37,890 | $39,027 | $184,094 |
| ↳ Platform Fees | – | -$7,031 | -$7,245 | -$7,465 | -$7,692 | -$7,926 | -$37,360 |
| Net Revenue | – | $70,337 | $72,476 | $74,681 | $76,952 | $79,293 | $373,739 |
| EXPENSES | |||||||
| Bills & Expenses | – | -$18,584 | -$18,602 | -$18,620 | -$18,639 | -$18,659 | -$93,105 |
| ↳ Property Tax | – | -$3,038 | -$3,038 | -$3,038 | -$3,038 | -$3,038 | -$15,190 |
| ↳ Insurance | – | -$1,200 | -$1,200 | -$1,200 | -$1,200 | -$1,200 | -$6,000 |
| ↳ HOA | – | – | – | – | – | – | – |
| ↳ Maintenance | – | -$2,000 | -$2,000 | -$2,000 | -$2,000 | -$2,000 | -$10,000 |
| ↳ Property Mgmt | – | -$586 | -$604 | -$622 | -$641 | -$661 | -$3,115 |
| ↳ Utilities | – | -$6,000 | -$6,000 | -$6,000 | -$6,000 | -$6,000 | -$30,000 |
| ↳ Cleaning | – | -$5,760 | -$5,760 | -$5,760 | -$5,760 | -$5,760 | -$28,800 |
| ↳ Reserves | – | – | – | – | – | – | – |
| RETURNS | |||||||
| Income After Bills | – | $51,753 | $53,874 | $56,060 | $58,313 | $60,634 | $280,634 |
| Cash Flow | – | $51,753 | $53,874 | $56,060 | $58,313 | $60,634 | $280,634 |
| Running Total | -$549,900 | -$498,147 | -$444,273 | -$388,213 | -$329,900 | -$269,266 | -$269,266 |
| PROPERTY SALE – END OF YEAR 5 | |||||||
| Estimated Sale Value | – | – | – | – | – | $489,900 | $489,900 |
| Selling Costs | – | – | – | – | – | -$45,475 | -$45,475 |
| Net Sale Proceeds | – | – | – | – | – | $712,449 | $712,449 |
| Total Cash Received | – | – | – | – | – | $773,083 | $993,083 |