Investment Opportunity
Coffee
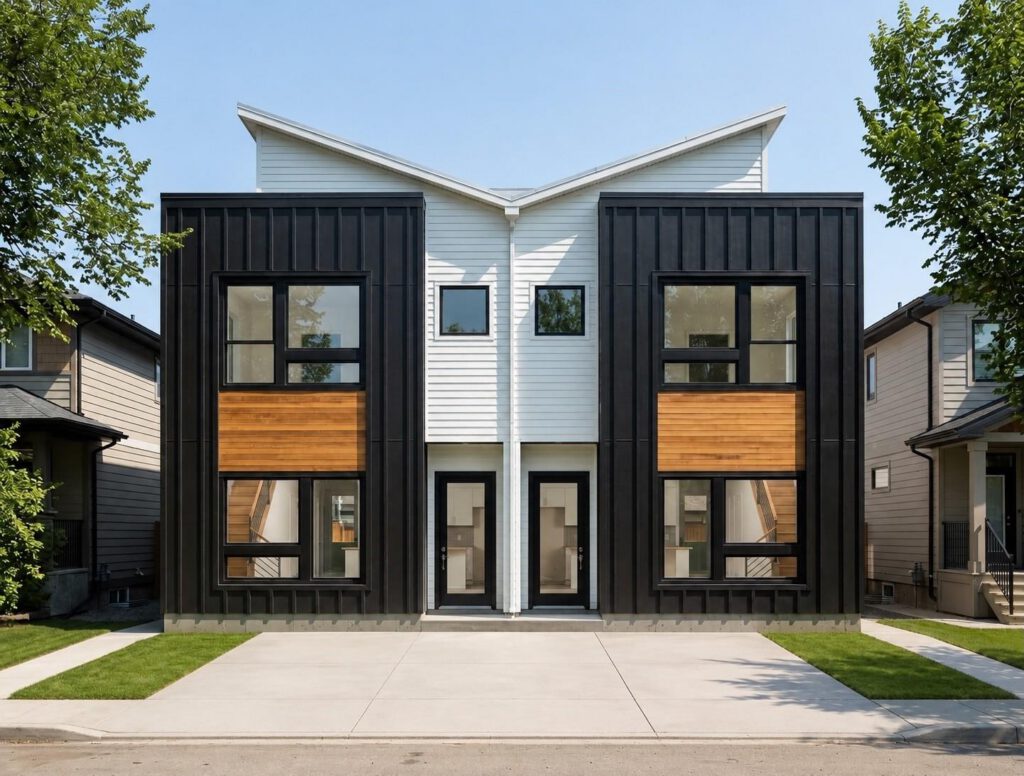
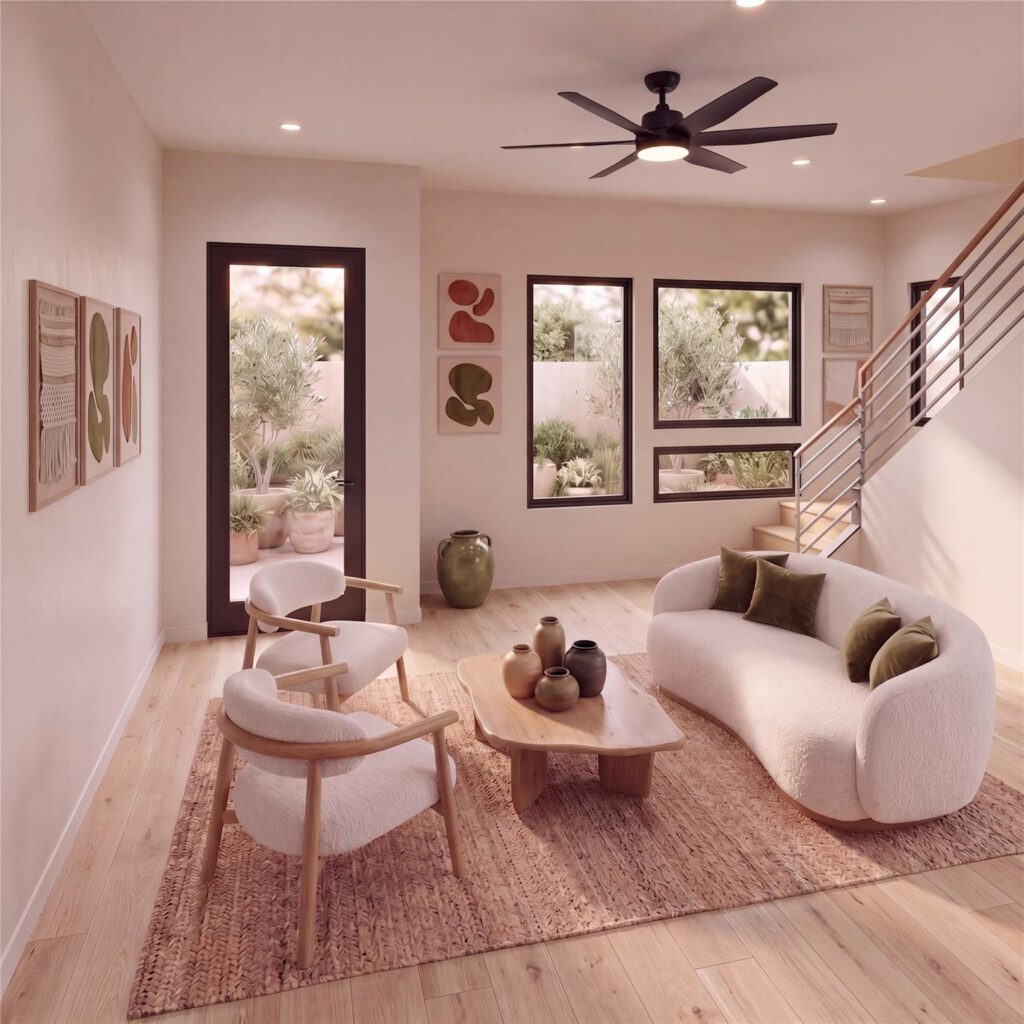
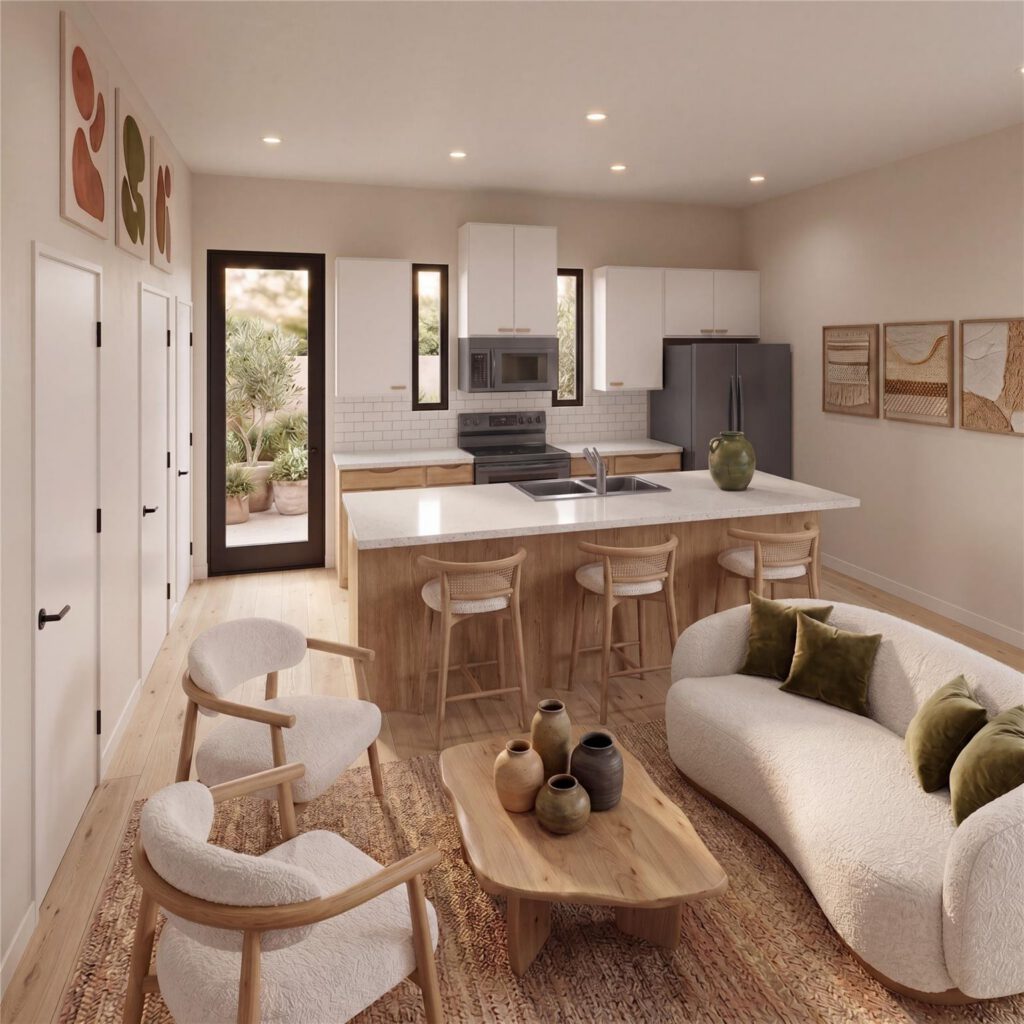
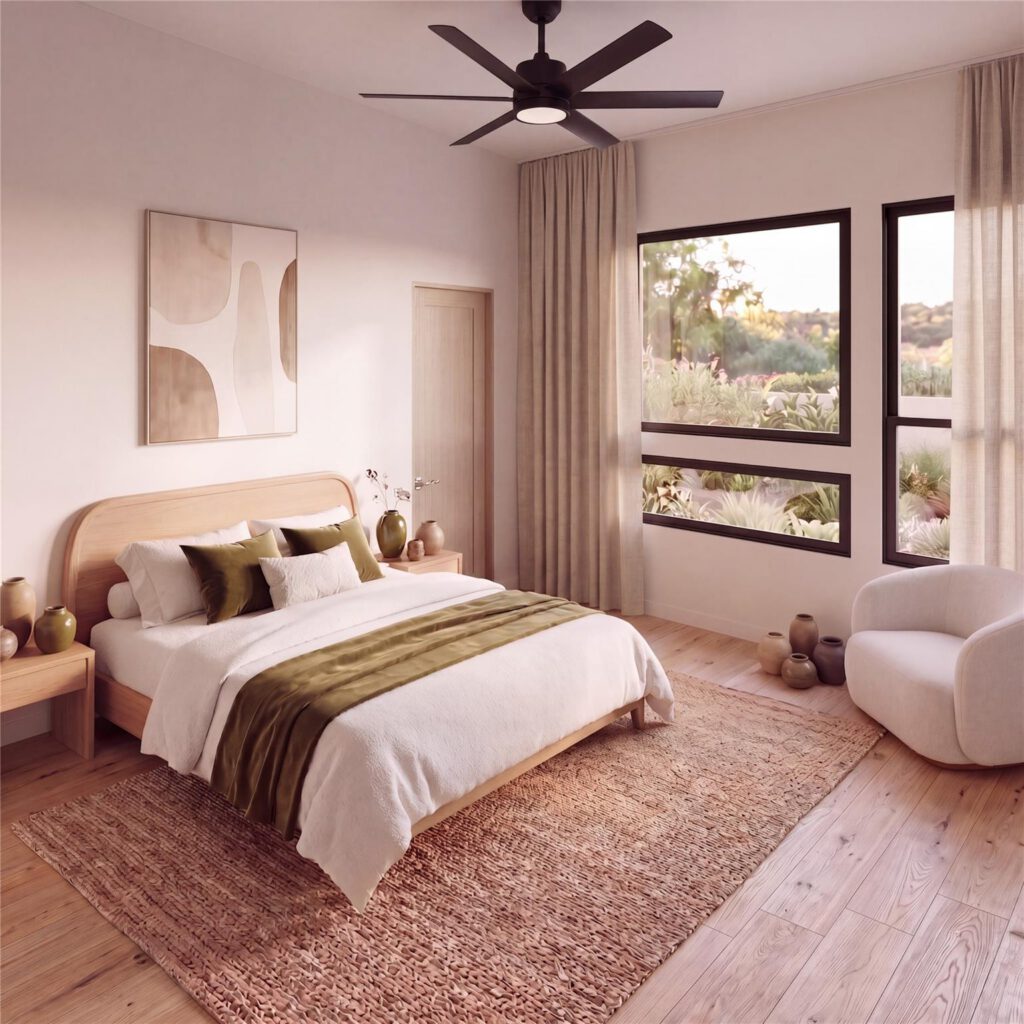
Image Gallery
Property Details
City
Houston
Houston
State
TX
TX
Zip Code
77033
77033
Beds
2
2
Baths
2
2
Aread
2,000 sqft
2,000 sqft
Year Built
2026
2026
Capital Summary
Purchase Price
$399,900
$399,900
Furnishing Cost
$50,000
$50,000
Setup Fees
$7,000
$7,000
Legal Fees
$3,000
$3,000
Total Budget
$459,900
$459,900
Investment Structure
Total Investment Required
$459,900
$459,900
Total Units
9
9
Price Per Unit
$50,000
$50,000
Ownership Per Unit
11.11%
11.11%
Minimum Units
1
1
Holding Period (Years)
5
5
Profitability Analysis
Total ROI
67.41%
67.41%
Cap Rate
13.14%
13.14%
Net Sale Proceeds
$484,296
$484,296
Total Net Rental Income
$285,628
$285,628
Equity Multiple
1.67
1.67
Total Return
$310,025
$310,025
Average Monthly Cash Flow
4,760
4,760
Average Annual Lifecycle ROI
13.48%
13.48%
Cash Flow
Annual Cash Flow – 5-Year Analysis
| Category | Year 0 | Year 1 | Year 2 | Year 3 | Year 4 | Year 5 | Total |
|---|---|---|---|---|---|---|---|
| INITIAL INVESTMENT (YEAR 0) | |||||||
| Purchase Price | -$399,900 | – | – | – | – | – | -$399,900 |
| Closing Costs | – | – | – | – | – | – | – |
| Setup Fees | -$7,000 | – | – | – | – | – | -$7,000 |
| Legal Fees | -$3,000 | – | – | – | – | – | -$3,000 |
| Rehab / Furnishing | -$50,000 | – | – | – | – | – | -$50,000 |
| Initial Reserve | – | – | – | – | – | – | – |
| Total Capital Deployed | -$459,900 | – | – | – | – | – | -$459,900 |
| BOOKING REVENUE | |||||||
| Booking Revenue | – | $68,831 | $70,925 | $73,082 | $75,305 | $77,595 | $365,739 |
| ↳ Unit 1 | – | $33,945 | $34,963 | $36,012 | $37,093 | $38,205 | $180,219 |
| ↳ Unit 2 | – | $33,945 | $34,963 | $36,012 | $37,093 | $38,205 | $180,219 |
| ↳ Platform Fees | – | -$2,065 | -$2,128 | -$2,192 | -$2,259 | -$2,328 | -$10,972 |
| Net Revenue | – | $73,336 | $75,567 | $77,865 | $80,234 | $82,674 | $389,676 |
| EXPENSES | |||||||
| Bills & Expenses | – | -$20,771 | -$20,790 | -$20,809 | -$20,829 | -$20,849 | -$104,047 |
| ↳ Property Tax | – | -$8,200 | -$8,200 | -$8,200 | -$8,200 | -$8,200 | -$41,000 |
| ↳ Insurance | – | -$1,200 | -$1,200 | -$1,200 | -$1,200 | -$1,200 | -$6,000 |
| ↳ HOA | – | – | – | – | – | – | – |
| ↳ Maintenance | – | -$200 | -$200 | -$200 | -$200 | -$200 | -$1,000 |
| ↳ Property Mgmt | – | -$611 | -$630 | -$649 | -$669 | -$689 | -$3,247 |
| ↳ Utilities | – | -$4,800 | -$4,800 | -$4,800 | -$4,800 | -$4,800 | -$24,000 |
| ↳ Cleaning | – | -$5,760 | -$5,760 | -$5,760 | -$5,760 | -$5,760 | -$28,800 |
| ↳ Reserves | – | – | – | – | – | – | – |
| RETURNS | |||||||
| Income After Bills | – | $52,565 | $54,777 | $57,056 | $59,405 | $61,825 | $285,628 |
| Cash Flow | – | $52,565 | $54,777 | $57,056 | $59,405 | $61,825 | $285,628 |
| Running Total | -$459,900 | -$407,335 | -$352,558 | -$295,502 | -$236,097 | -$174,272 | -$174,272 |
| PROPERTY SALE – END OF YEAR 5 | |||||||
| Estimated Sale Value | – | – | – | – | – | $399,900 | $399,900 |
| Selling Costs | – | – | – | – | – | -$30,913 | -$30,913 |
| Net Sale Proceeds | – | – | – | – | – | $484,296 | $484,296 |
| Total Cash Received | – | – | – | – | – | $546,121 | $769,925 |